The OECD published the PISA 2025 results on 8 September. PISA is an international study that assesses how 15-year-old students cope with tasks in mathematics, reading, and science. Ninety-one countries and economies took part, which makes it one of the main sources that allows us to compare the knowledge and skills of 15-year-old students in different countries and track changes over time. It is not an olympiad: it tests whether a 15-year-old can read, reason and apply basic knowledge. In addition to the tasks, the study included a survey of both the students themselves and the principals of the schools they attend.
At Morim Foundation, a young Israeli public-benefit company that trains and supports teachers, we read the OECD and RAMA reports1 and ran our own analysis of the PISA data; where a number comes from our own calculations, we say so. Here is what stood out to us – and why it matters for teaching.
It is important to keep in mind: the available data do not allow us to identify causal relationships. We cannot conclude that certain characteristics of students, classes, or schools lead to poorer results. But we can identify patterns, compare Israel with other countries, and define reference points for our work: understand what deserves particular attention and where efforts should be directed.
Academic performance
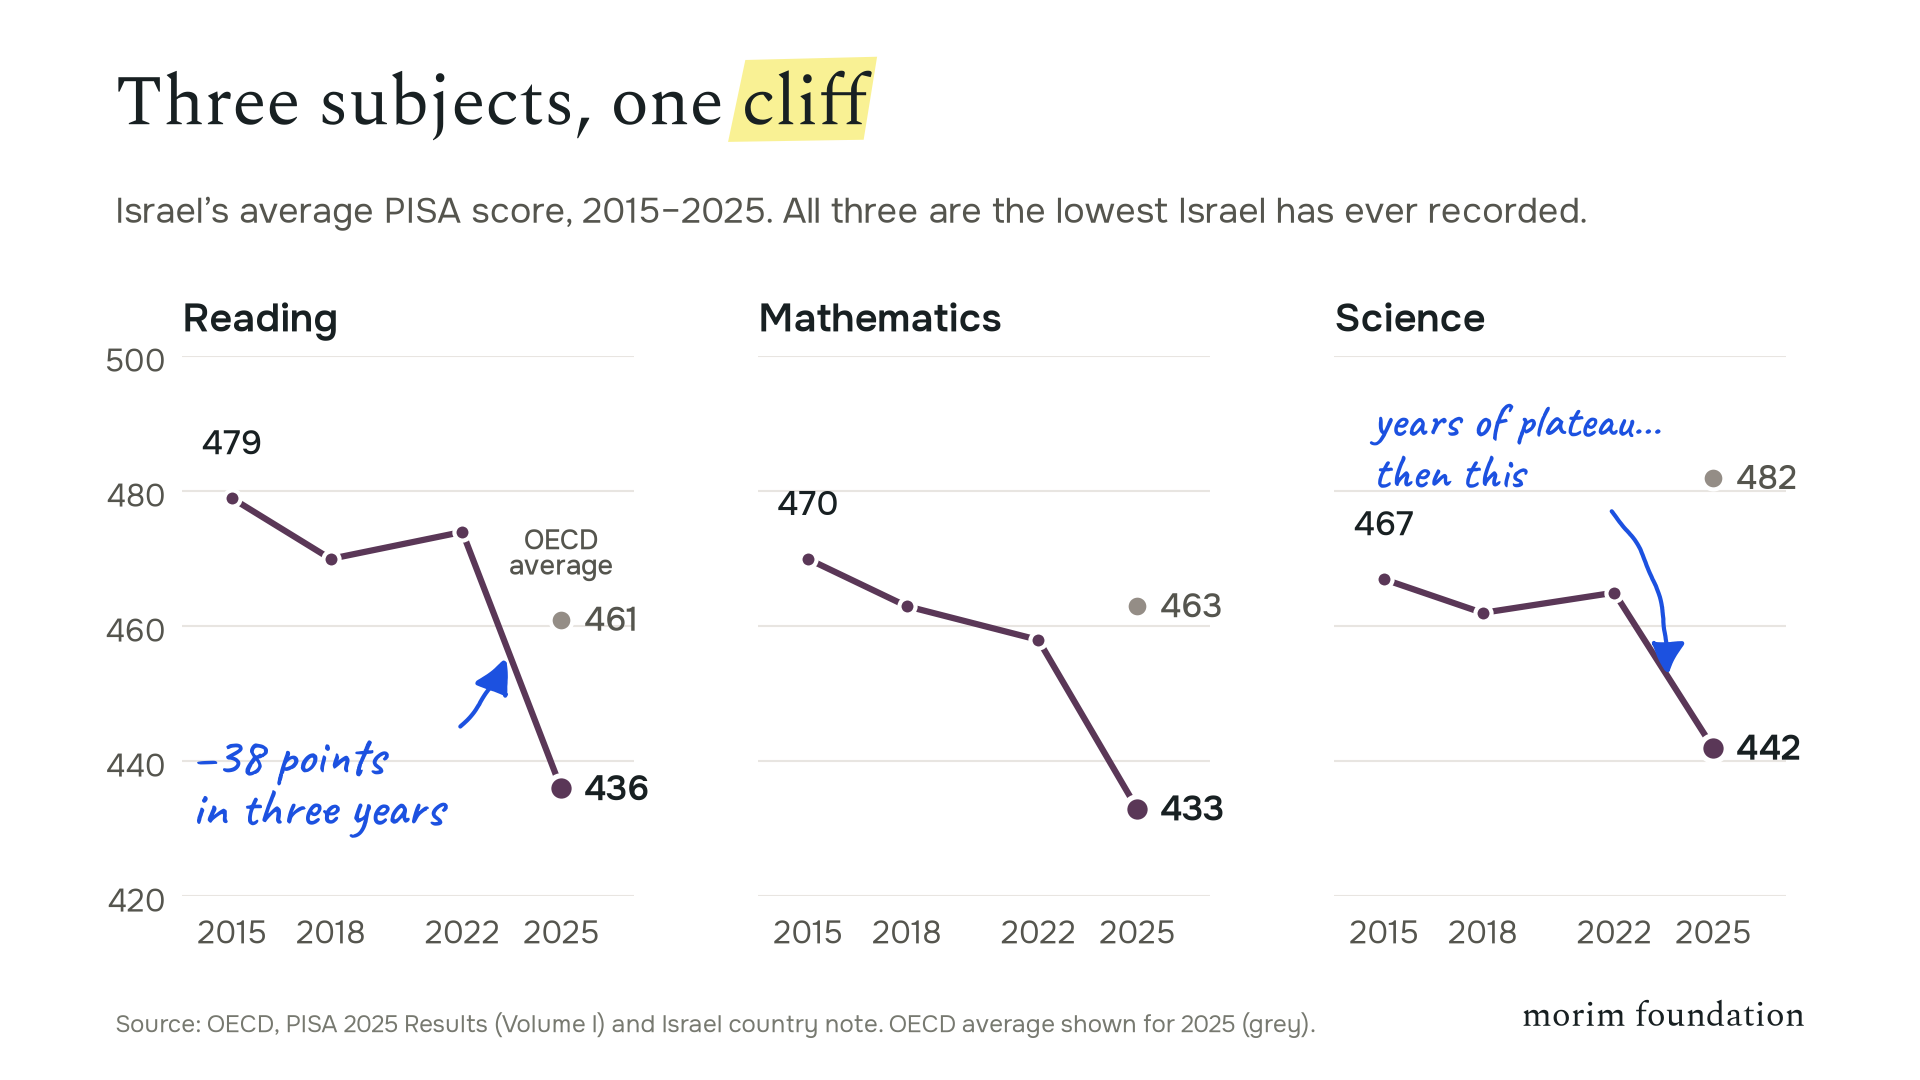
Israel’s average fell in all three subjects compared with 2022 – by 38 points in reading, 25 in mathematics and 23 in science, one of the steepest declines of any country in the study. Scores are now the lowest in Israel’s PISA history and below the OECD average in every subject. The test was taken in 2025, while the war was still going on. The sample left out evacuated schools and schools on the northern confrontation line, and principals could also exclude students affected by the war themselves or through close family. If anything, these numbers may understate the problem.
The averages also conceal significant differences between students. Inequality in Israel is among the highest in the world: the gap between the strongest 10% and the weakest 10% of students is 304 points in reading, 290 in science and 269 in mathematics. Israel has the third-widest gap of all participating countries in reading and science, and the eighth-widest in mathematics. Compared with 2022, this gap narrowed in reading, but this is not a reduction we can celebrate: results worsened among both stronger and weaker students; stronger students simply lost significantly more in reading.
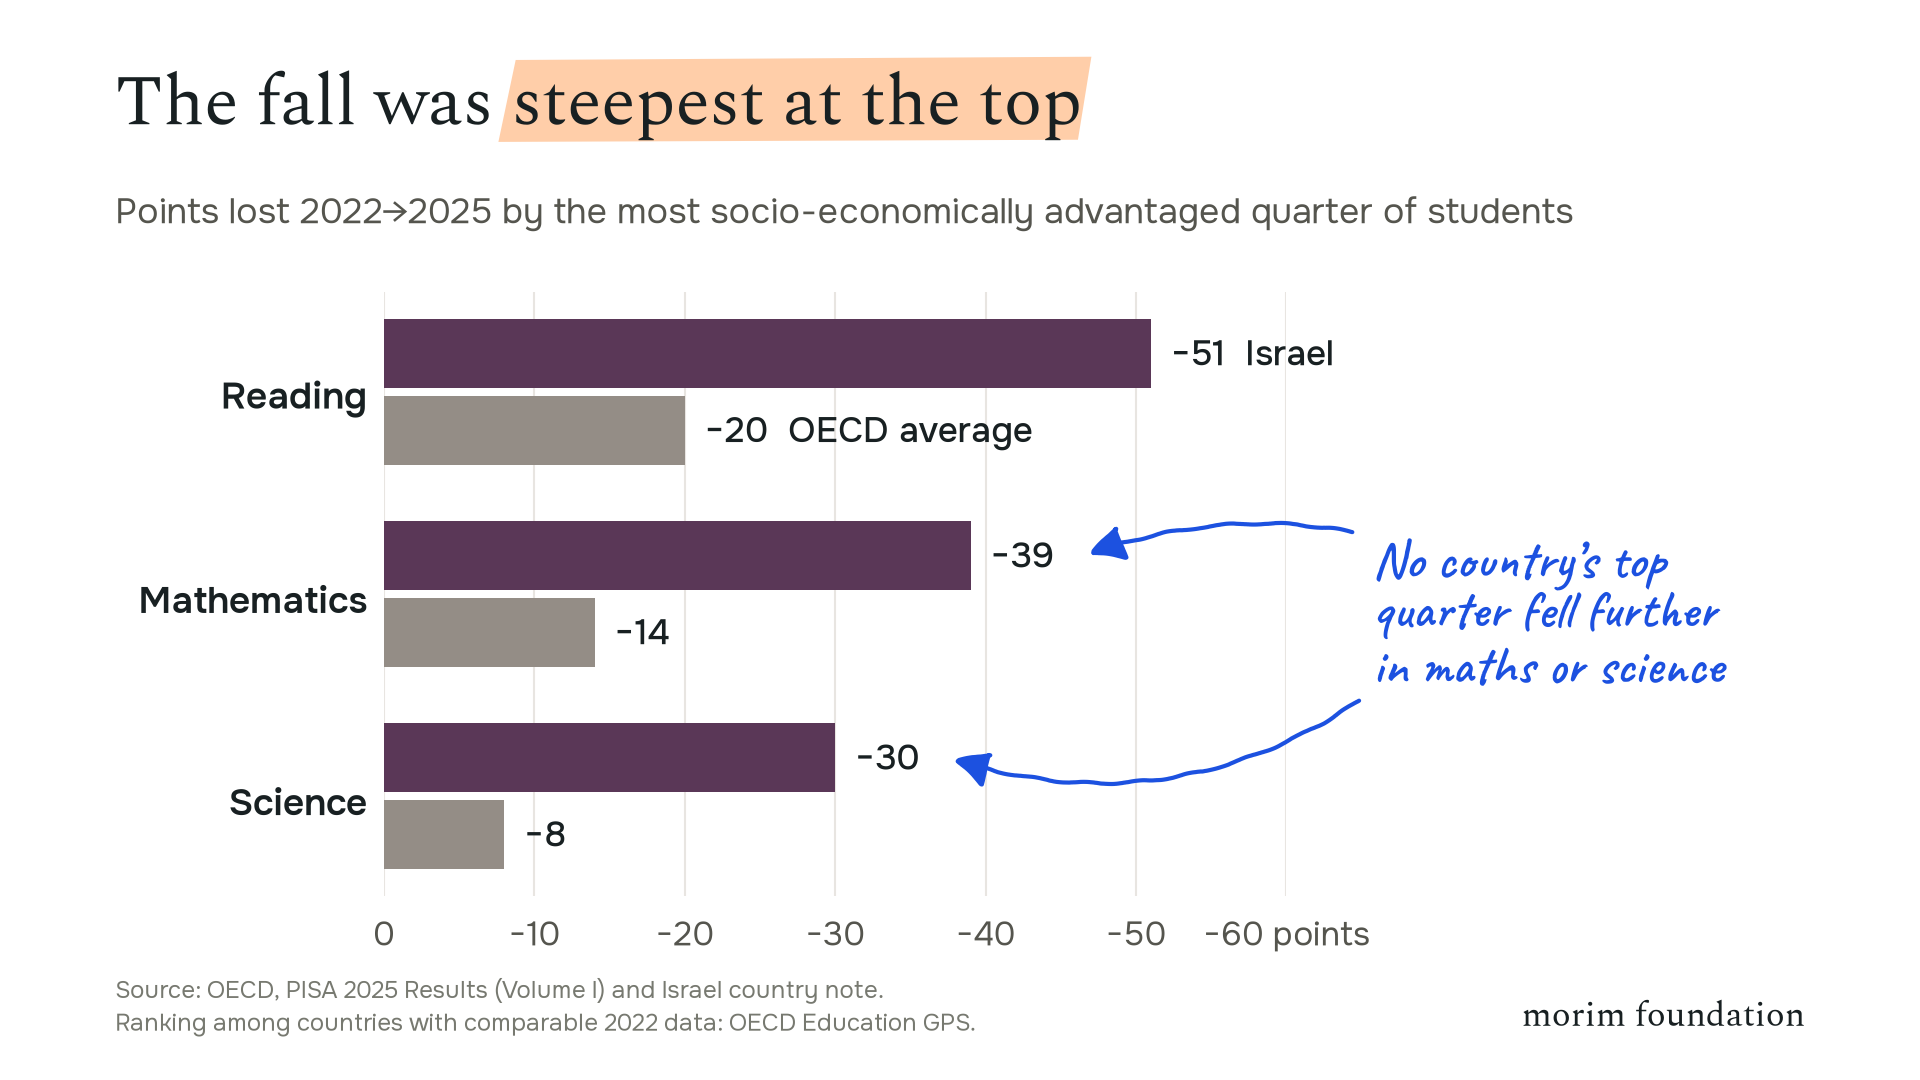
We see a similar picture when students are divided by socio-economic status. The average results of the most advantaged 25% of students declined by 51 points in reading, 39 in mathematics, and 30 in science – the steepest drop of any country with comparable data in mathematics and science, and the second-steepest in reading. On average across OECD countries, the decline in this group was much smaller: 20, 14, and 8 points, respectively. This is not only a story about disadvantaged schools.
The decline also hit school sectors unevenly. Take the results of girls from Haredi schools, for example. Their results not only declined less sharply than those of girls from secular state schools; they now outperform them by 38 points in reading, while in mathematics and science the results of these groups are not statistically different. The widest gap, though, is still between language groups: only 23% of Arabic-speaking students reached basic proficiency in mathematics, against 62% of Hebrew-speaking students.
But scores themselves are only part of the picture. PISA also shows what surrounds students at school – and how they themselves approach learning.
The influence of the school environment
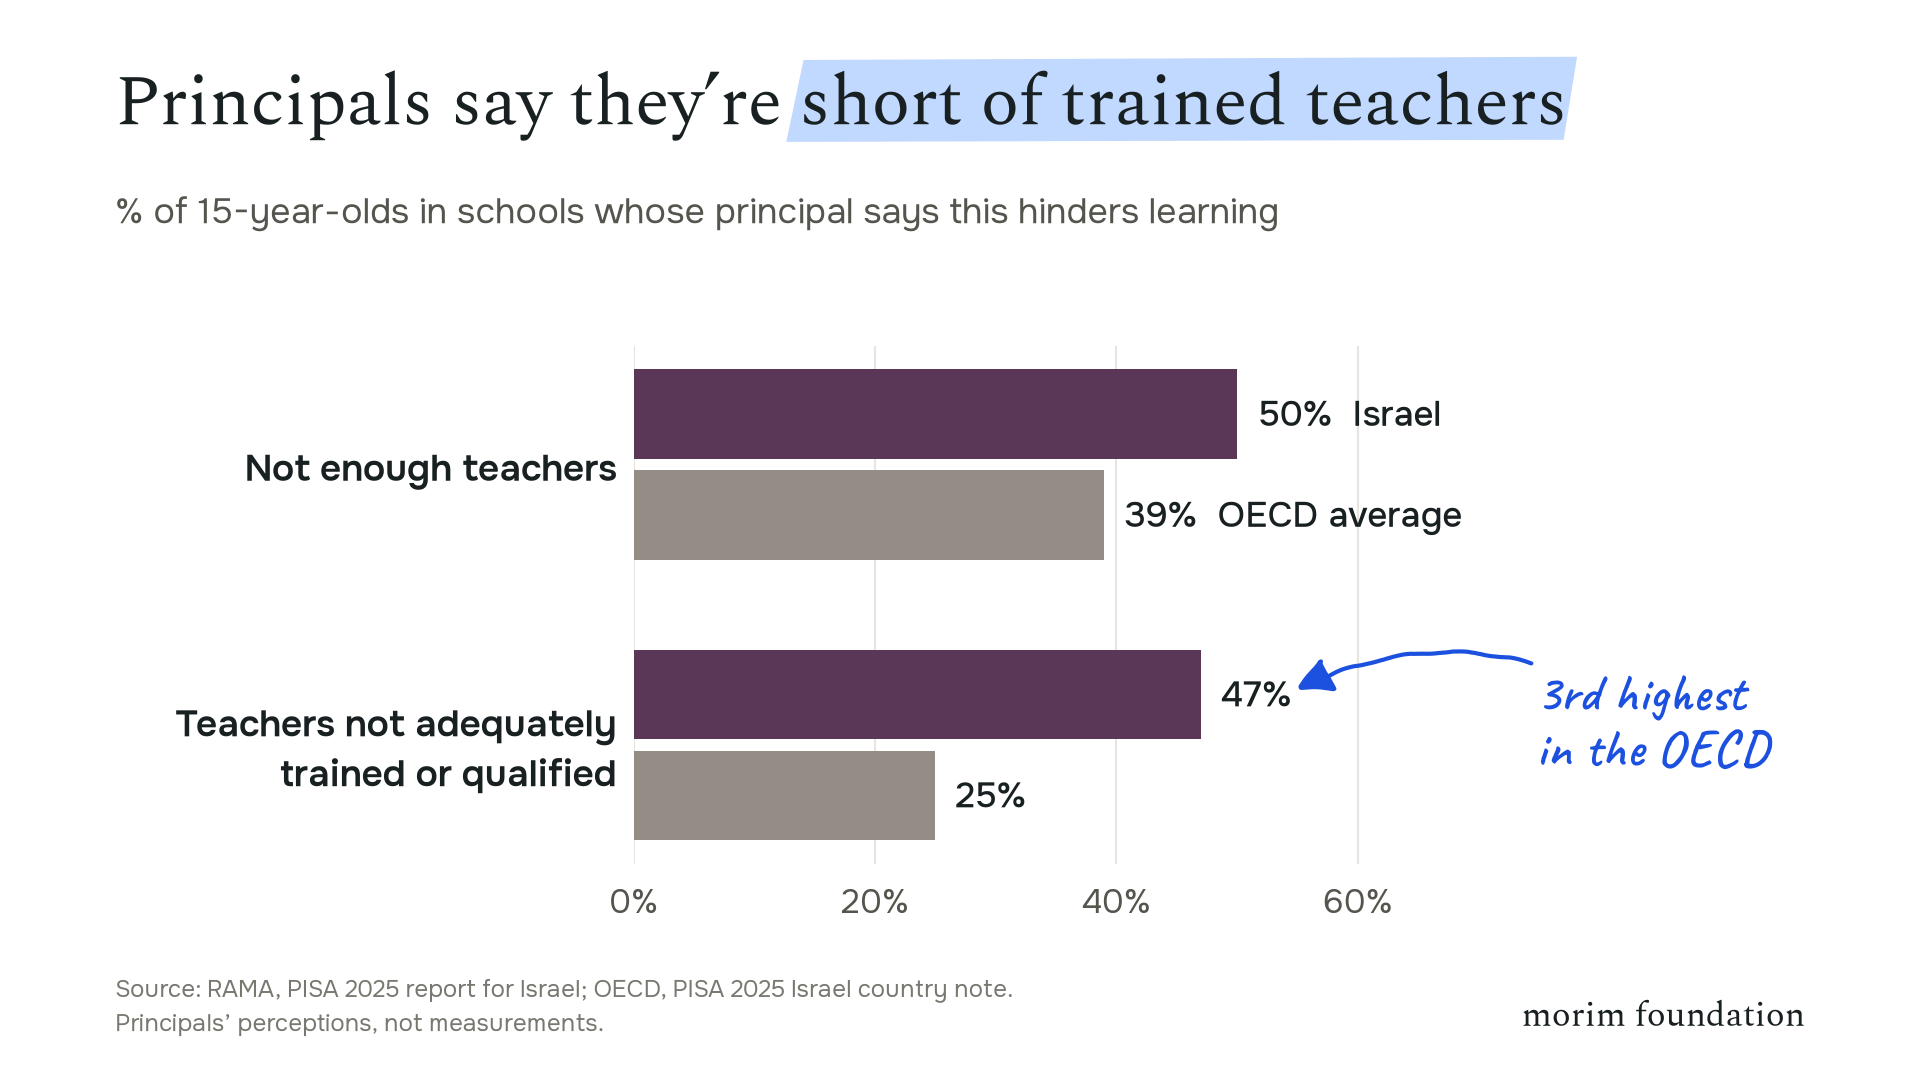
Let us begin with the school environment, and start with teachers. Half of Israeli students attend schools whose principals say a shortage of teachers hinders learning (OECD average: 39%). And 47% attend schools whose principals say that teachers who are not adequately trained or qualified hinder learning, nearly double the OECD average of 25%, and the third-highest share in the OECD. These are principals’ perceptions rather than measurements, but for a foundation that trains teachers, this is the number we keep coming back to.
Then there are screens. By their own estimate, Israeli students spend an average of 1.6 hours a day on digital devices for leisure during school hours alone (OECD average: 1.1), the second-highest figure among 88 countries and economies. Students who say classmates are distracted by devices in science lessons score 22 points lower in science, twice the OECD-average gap of 11 points.
This observation cannot be reduced simply to the idea that the fewer digital devices, the better. We see a non-linear relationship: moderate use of digital devices for learning is associated with higher science results than either their complete absence or very intensive use. For social media, our own calculations single out heavy use: students who spend more than five hours a school day on social networks score about 20 points lower in science than those who spend one to three hours, even after accounting for family background. The differences among non-users, light users and moderate users are within the margin of error. (Only 43% of Israeli students answered these questions, and none in Haredi schools.)
At the end of the day, classroom climate is a wider problem than screens: 30% of Israeli students say they cannot work well in most or all science lessons (OECD average: 19%).
Persistence and curiosity
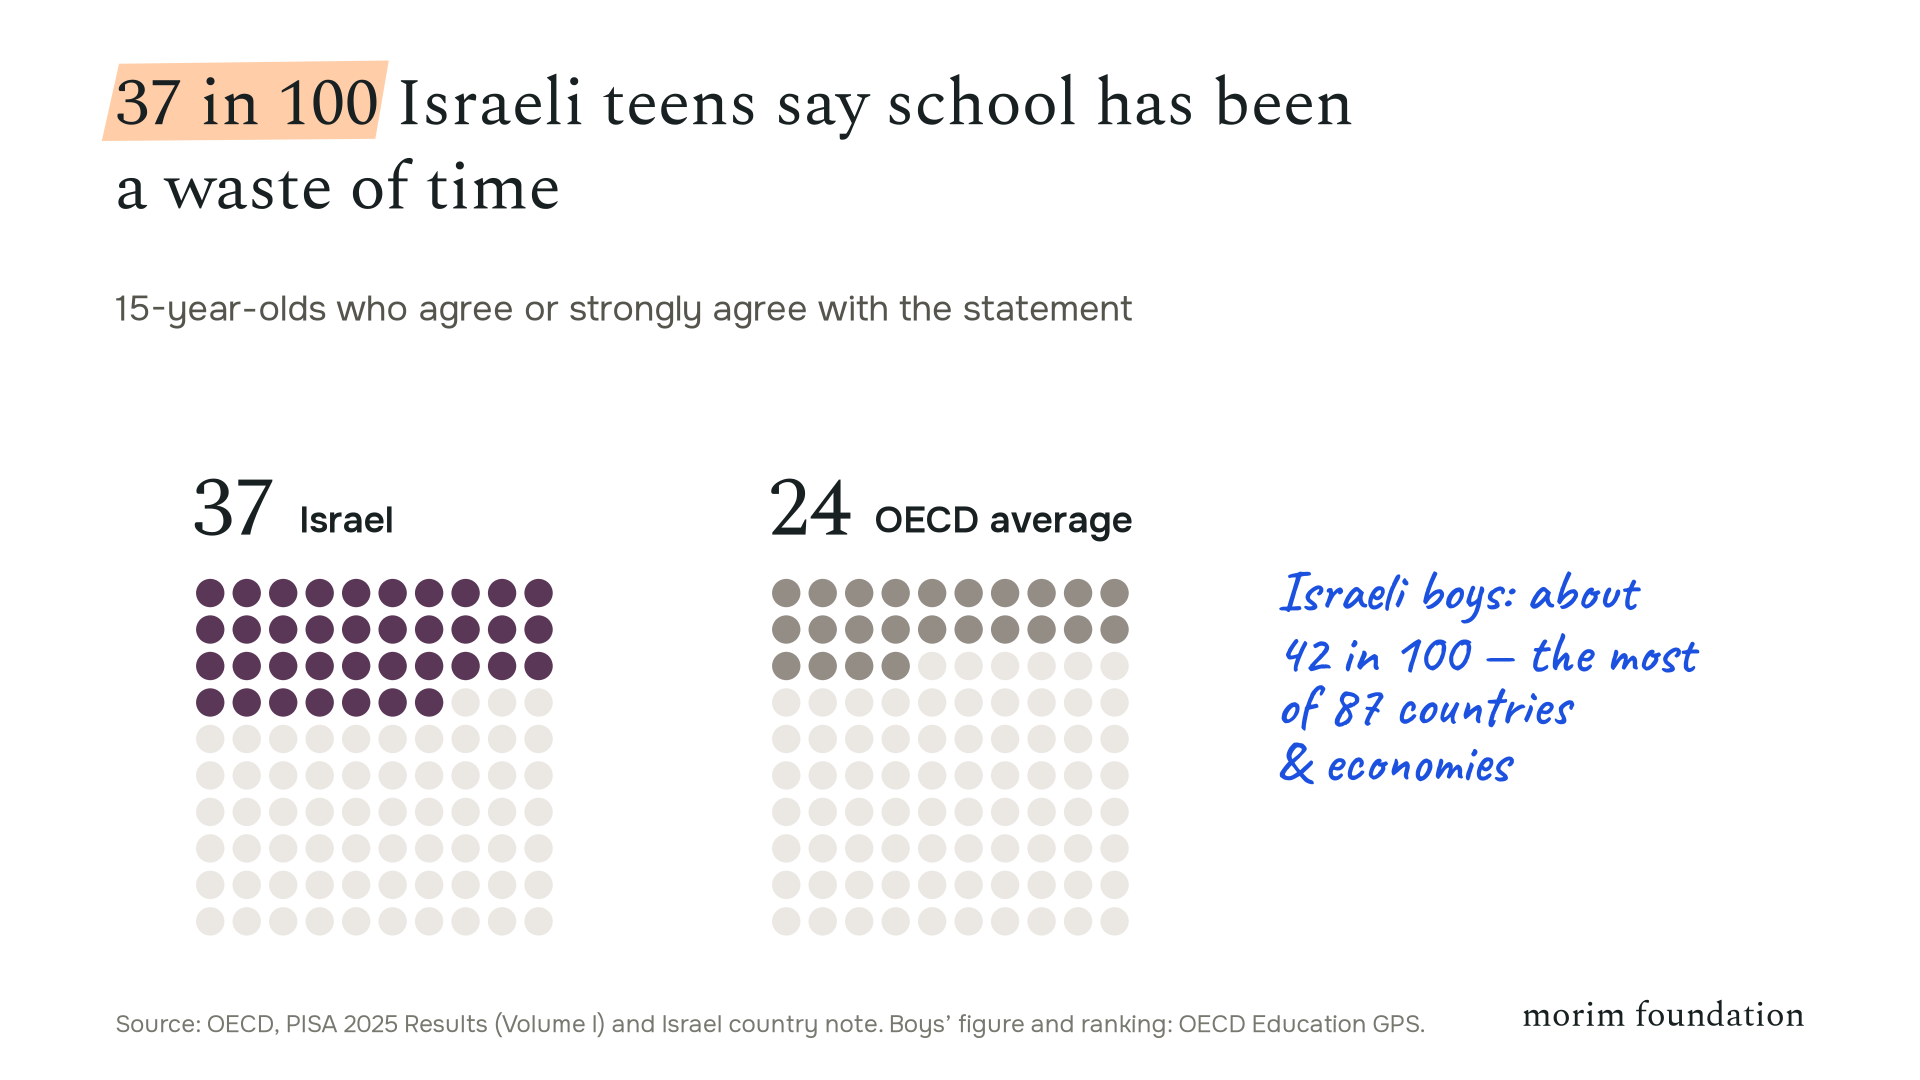
Now to the students themselves. The starkest finding concerns whether students see school as worthwhile: 37% of Israeli 15-year-olds agree that school has been a waste of time (OECD average: 24%), the second-highest share among 87 countries and economies – and Israeli boys say so more often than boys in any other participating country. So how do Israeli students behave when a task gets hard? PISA lets us look at this from two angles.
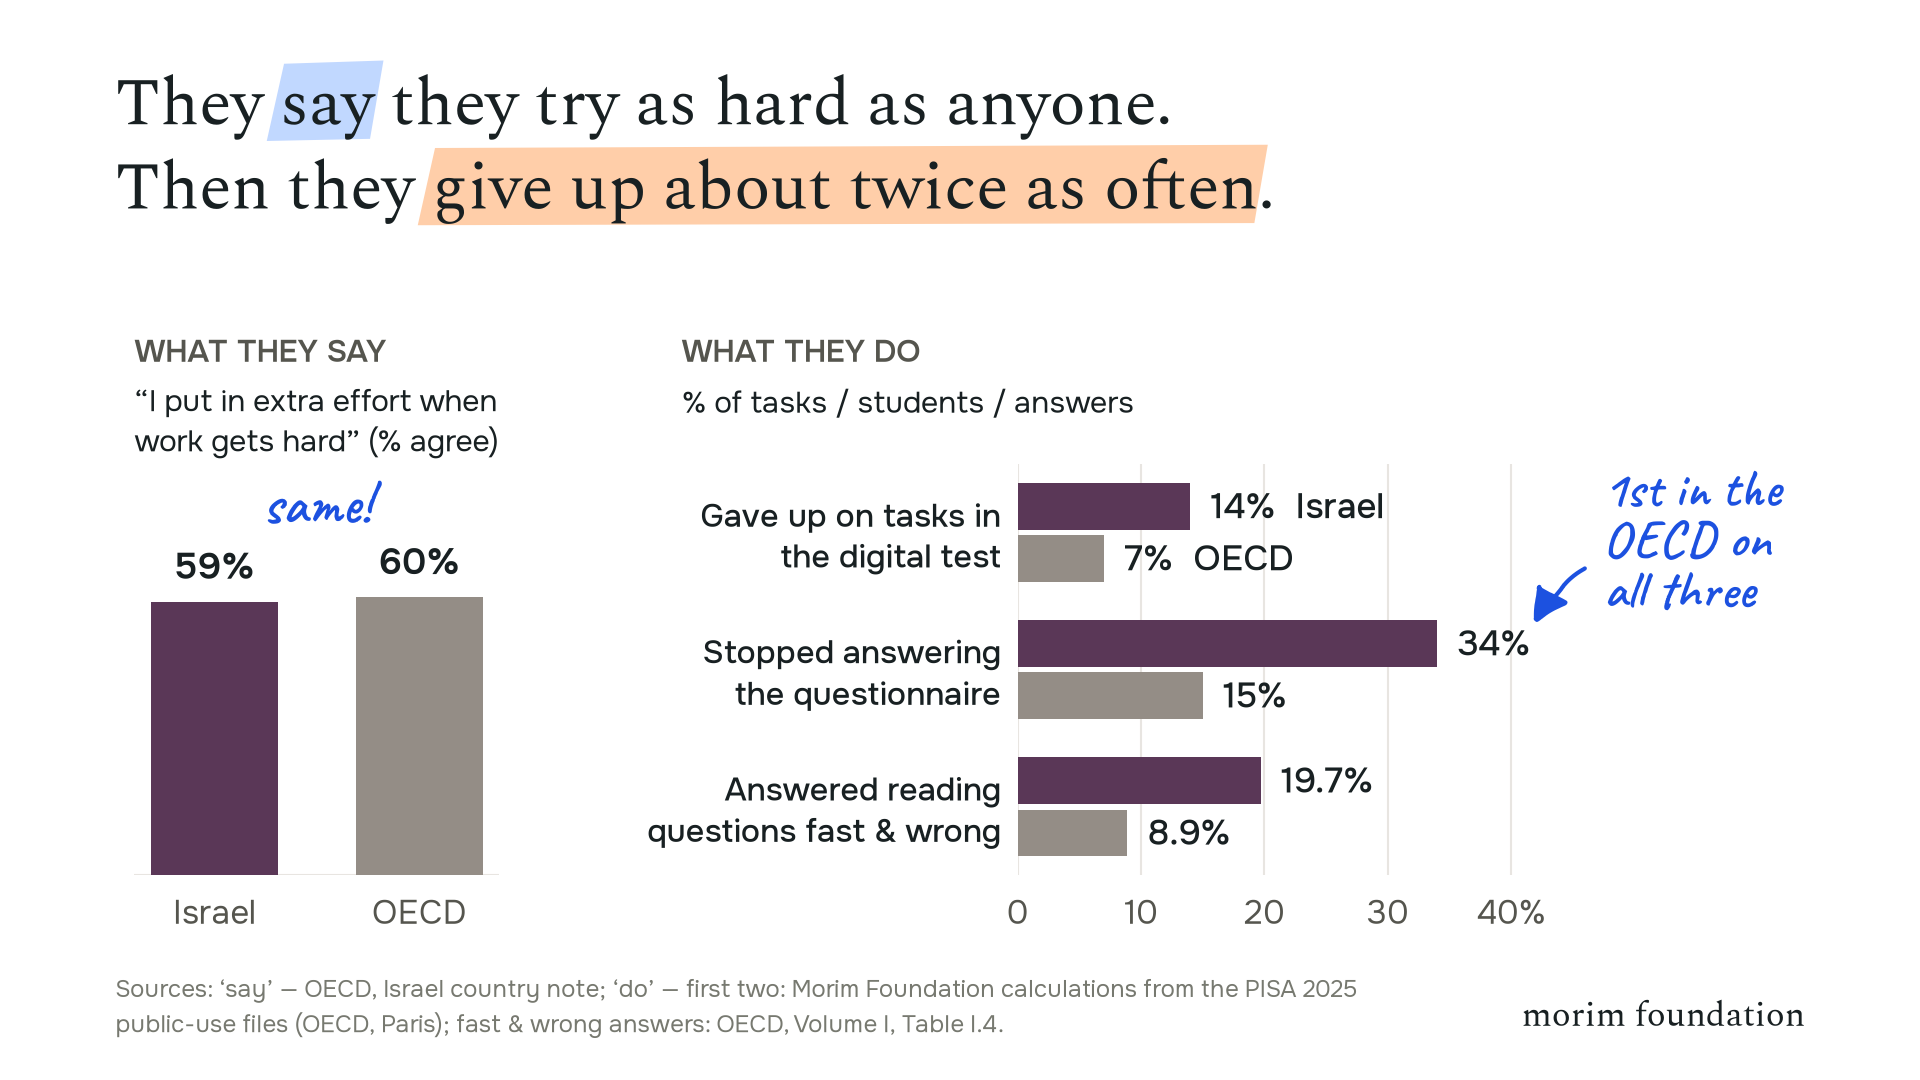
We can compare how students describe themselves with how they actually behave during the test, on three separate measures: how often they give up on tasks in PISA’s new interactive digital test, whether they stop filling in the questionnaire before the end, and how often they answer a reading question quickly but incorrectly – a guess rather than an attempt.
By the self-reported numbers, Israeli students look like everyone else: 59% say they put in extra effort when work gets hard, against 60% across the OECD. In practice, they don’t. Israeli students gave up on 14% of tasks in the digital test (OECD: 7%); 34% stopped answering the questionnaire before its later sections (OECD: 15%); and 19.7% of their reading answers were fast and wrong (OECD: 8.9%). On all three measures, Israel is first in the OECD. The first two are our calculations from the PISA public data; the third is the OECD’s. Nothing in PISA counts toward a student’s grades – which is the point: these numbers measure the willingness to keep going when nothing is at stake.
PISA also asked about curiosity. Israeli students report a little less of it than their OECD peers: 68% say they are curious about many different things, against 73% across the OECD. And curiosity goes with results. After accounting for socio-economic background, more curious students score higher in science, and the OECD finds the link stronger in Israel than on average. In our own calculations it is the strongest of all 34 OECD countries, and Israel is one of only four, with Denmark, Iceland and Latvia, where curiosity goes with science scores as strongly as family background does. We see the same link in reading and mathematics.
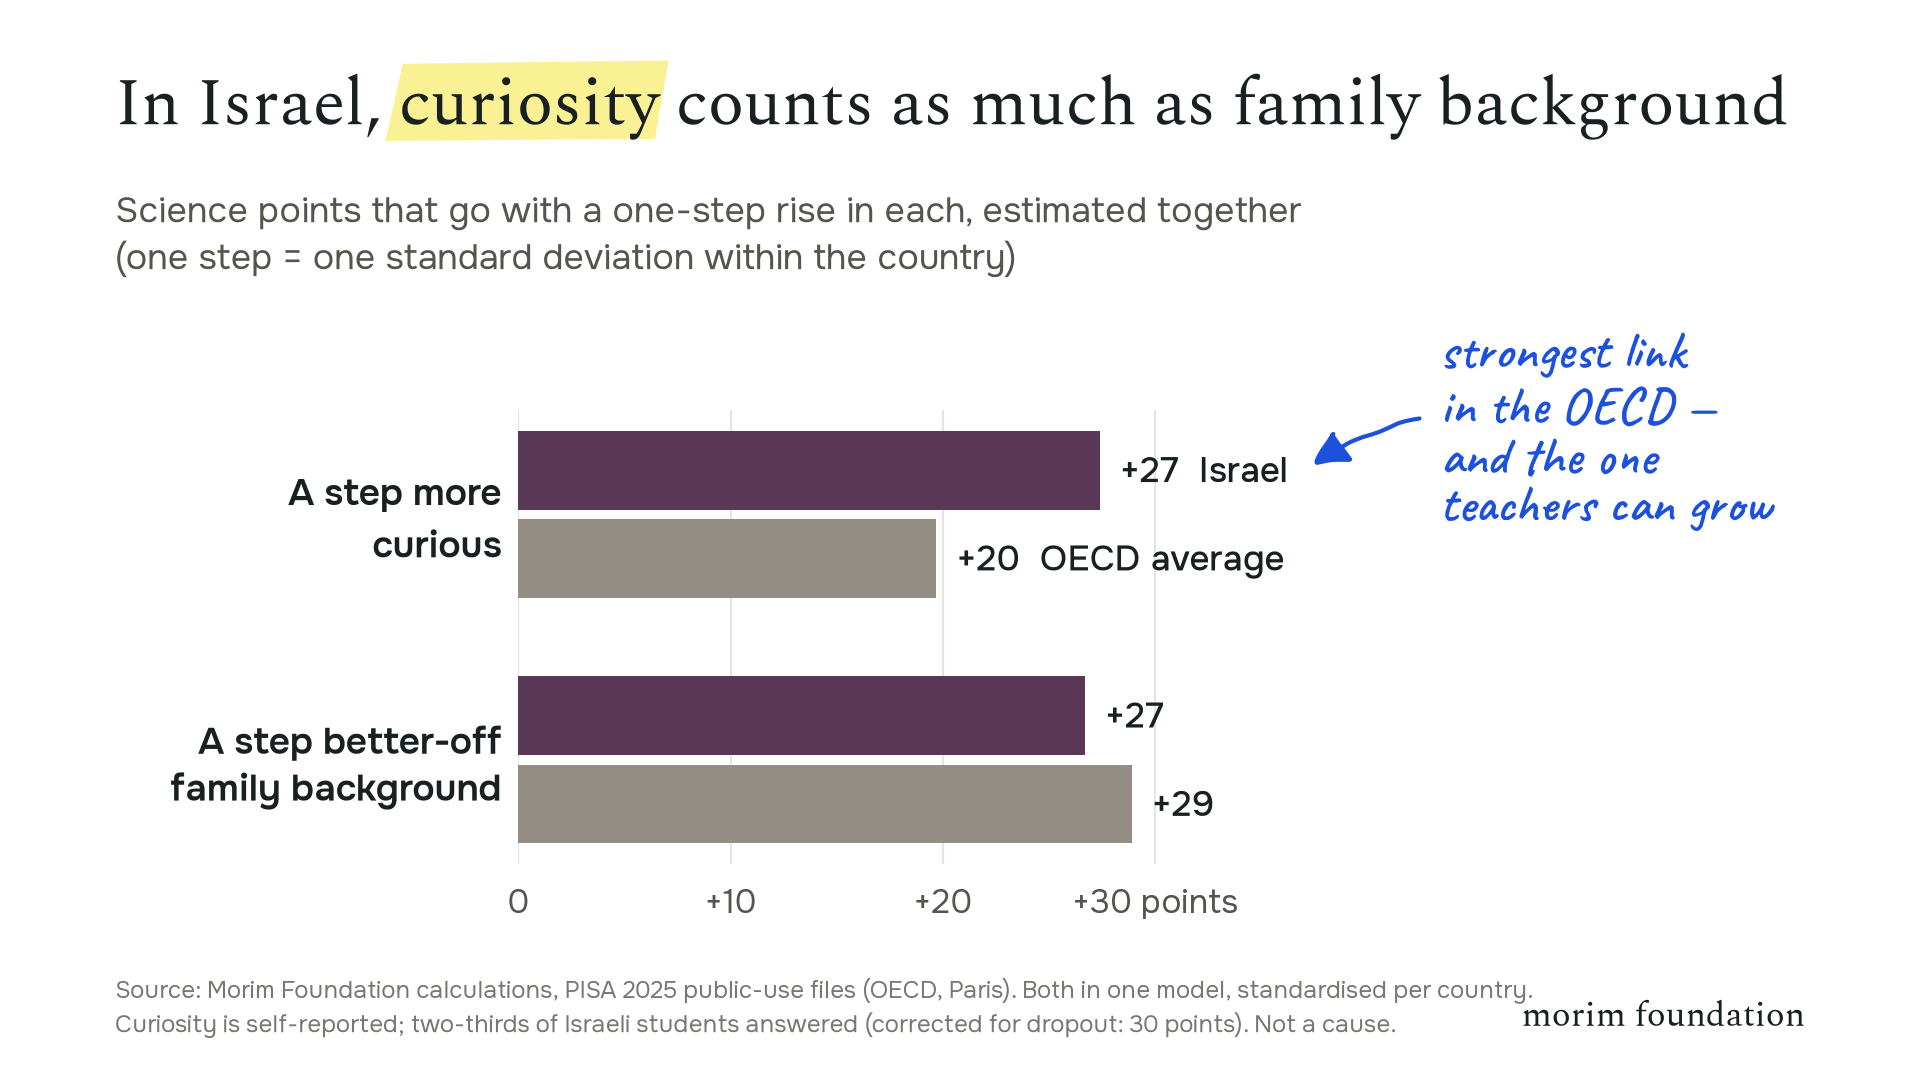
This observation should be treated with caution: students themselves reported how curious they were, the questions about this were asked at the end of a long questionnaire, and only two-thirds of students reached these questions at all. Correcting for which students dropped out does not weaken the link in our check – and the dropout itself is part of the persistence story above.
Where teachers come in
Persistence and curiosity are exactly where we work. Scores matter, but our focus is upstream of them: children’s curiosity, their willingness to stay with a problem that doesn’t give way at once, and the pleasure of finally cracking it. By 15, as PISA shows, the habit of giving up is already measurable. So we start earlier – with teachers of late primary and early middle school, the years before motivation fades.
We believe the teacher is the strongest lever here – and, as the principals’ answers above suggest, teachers are not getting the preparation and backing they need. So we train them, and we stay with them afterwards.
In our programmes, we work with teachers in three areas:
- starting lessons from a real question rather than a ready answer, and leading discussions where children argue with each other instead of guessing what the teacher wants to hear;
- working with group dynamics and with frustration – the moment a child wants to give up – finding the balance between helping and letting children struggle productively, and changing course when a real discussion opens up;
- developing the teacher’s own professional stance – the ability to lead a class and stay steady in it.
These are cross-disciplinary skills that cannot be learned only from books or lectures. Teachers need to try new approaches in the classroom, discuss their experiences, return to difficult situations, and look for other solutions. Therefore, our programmes are built around practice, reflection, and long-term support.
If these numbers look familiar from your own classroom or school, we would like to hear from you – teachers, principals and school coordinators (rakazim) alike. More about us at morim.foundation.